Deep Dive: Klaveness Combination Carriers ASA (Ticker symbol: KCC)
Dear fellow value investors,
Today’s company operates in a niche that is neither the dry bulk nor the tanker segment, but in a segment known as combined carriers (or OBO vessels — Ore/Bulk/Oil). Namely, these carriers can transport both liquid and dry bulk cargoes. And this particular competitive edge is one of the advantages of Klaveness Combination Carriers ASA (KCC).
Let’s analyse the business.
Business overview
Klaveness Combination Carriers ASA was established in 2018, as a separate entity from the Rederiaksjeselskapet Torvald Klaveness Group (the Group controls around 54.68 per cent of KCC as of 31 December 2025 (1)). In 2021, Klaveness Combination Carriers ASA started to trade on the Euronext Oslo Stock Exchange under the ticker symbol: KCC.
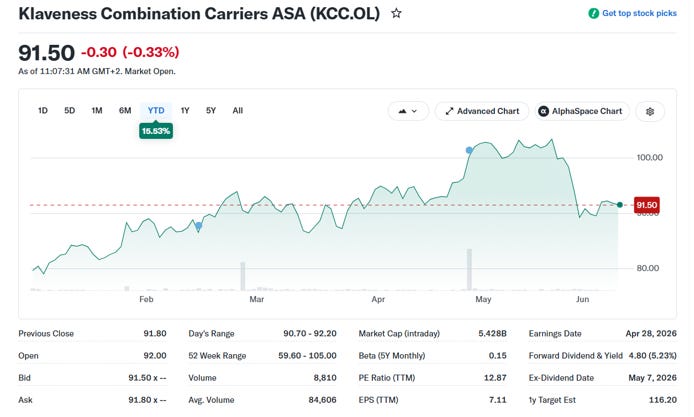
The market capitalisation is USD 5.43 billion, and the PE ratio is 12.87:
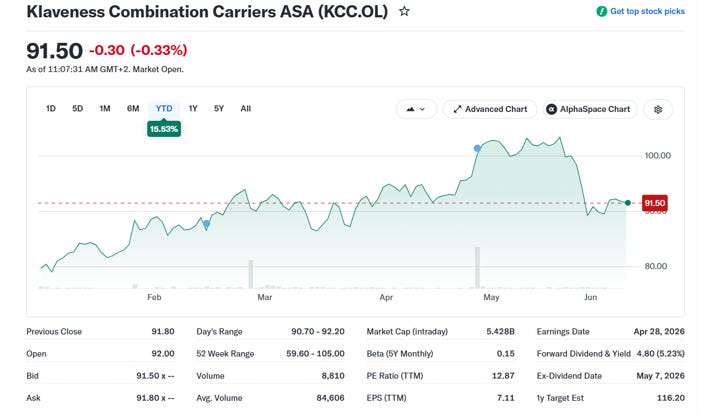
Source: Yahoo Finance
The company owns 18 vessels (8 CLEANBU and 11 CABU vessels) with an average age of 11 years. As mentioned above, these combined carriers give KCC a competitive advantage, such as less ballast sailing. So instead of directly ballasting free of cargo back to their loading ports, the vessels load in the discharge port area and discharge in the port of loading geographical area, thereby minimising the ballasting days (or please read better utilisation) and increasing earnings via employment. That’s because these vessels can load both dry bulk and liquid cargoes.
Now, KCC’s business model is divided into:
- CLEANBU – clean petroleum bulk. On these vessels, they carry clean petroleum products or chemicals and return with a dry bulk cargo onboard.
- CABU – caustic bulk. These vessels usually carry caustic soda solution to alumina refineries and return with a dry bulk cargo such as bauxite or alumina.
On a side note, the caustic soda solution or sodium hydroxide (NaOH) is used in alumina refineries to dissolve alumina-bearing minerals from crushed bauxite.
So, the company provides transportation services for its CABU segment clients, which are located in Australia (alumina refineries), the Middle East (aluminium smelters) and the Far East (steel producers). Meanwhile, CLEANBU clients are mainly related to the energy and petrochemical industries. For instance, in 2025, the majority of KCC’s transported cargoes were fossil fuels, caustic soda and iron ore (1):
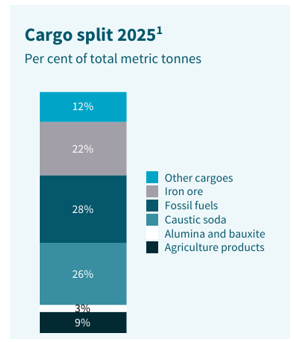
Source: KCC, Annual Report 2025
So, when we compare CLEANBU and CABU carriers with usual vessels, we have to compare them as follows:
- CLEANBU with LR1 product tankers and Kamsarmax dry bulk vessels.
- CABU with MR product tankers and Panamax dry bulk vessels.
Below is the map of the CABU and CLEANBU trading routes of KCC:
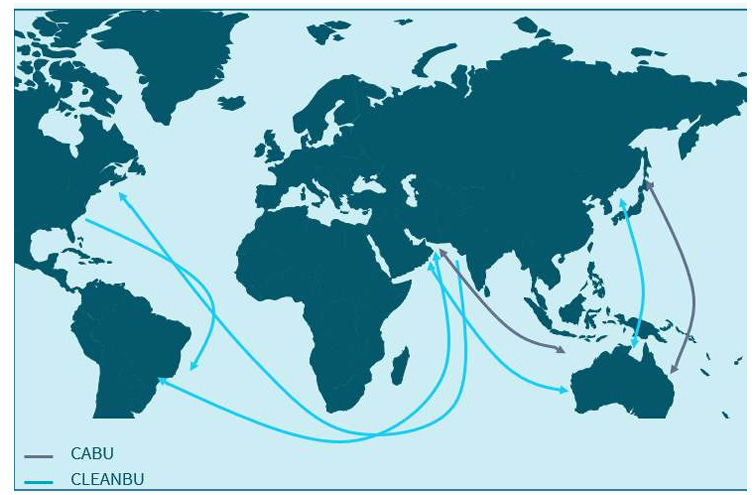
Source: KCC, Annual Report 2025
The company received in 2026 two new CABU vessels, which are already operational, and one is expected in Jul-August 2026.
The conflict in the Middle East and the effective closure of the Strait of Hormuz had a limited impact on CABU business and on the caustic soda solution market (as of now), but a strong impact on its CLEANBU business.
It is a very unusual business model that KCC operates in, but at the same time, a very interesting one.
Financials
Due to the situation in the Middle East, the Q1 2026 results were very strong:
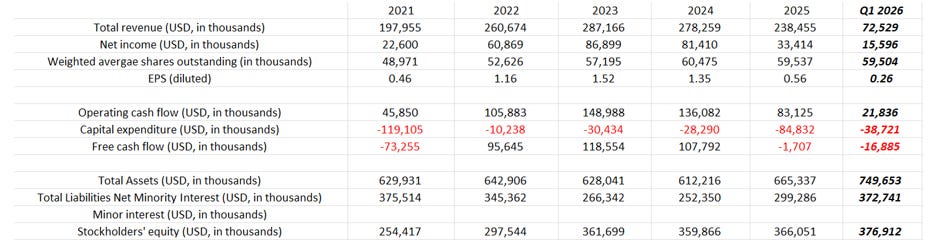
Source: Internal analysis based on KCC reports
If we compare the net income results of Q1 2026 with previous quarters, we can notice the stark differences:
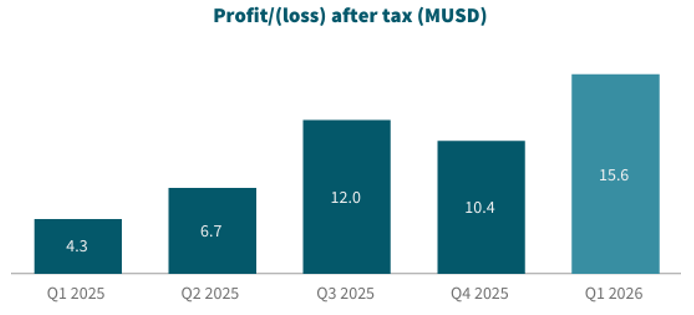
Source: KCC, First Quarter 2026, Apr 28, 2026
The management of KCC advised that the CABU business outperformed the relevant MR tanker market in Q1 2026, and CLEANBU benefited from the strong LR1 product tanker market, which was offset by the weaker dry bulk market. But the uncertainty is still there due to the fluid situation around the peace talks between the US and Iran.
The CAPEX (capital expenditure) in Q1 2026 was mostly related to the dry dock expenses (USD 0.7 million) and newbuild acquisitions (USD 36.5 million). In terms of the dry docking schedule of its fleet, two CABU vessels in Q2 2026, which are taking place now and one CLEANBU vessel is expected to be in dry dock in Q3 2026. As it’s planned and staggered, it doesn’t seem to create a significant loss of overall earnings.
The net debt has been climbing since 2023:
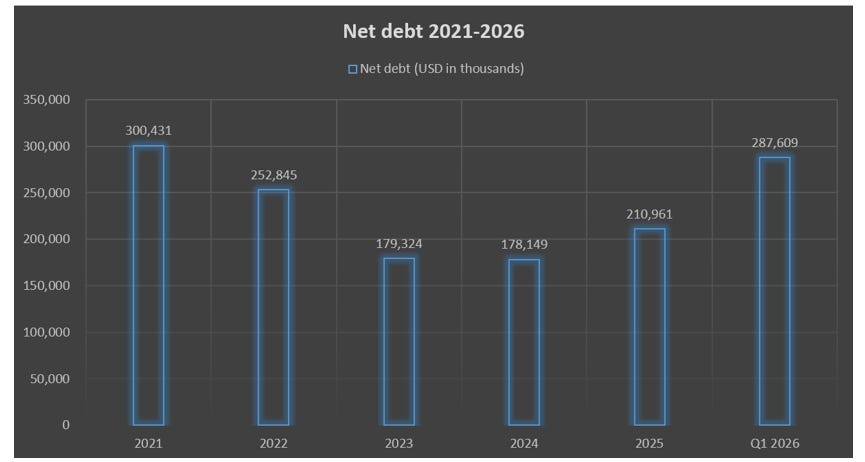
Source: Internal analysis based on KCC reports
The increased level of the net debt is mostly related to the three CABU III vessels ordered in 2023, and their delivery cost is estimated at USD 193.8 million. The above is part of the fleet renewal strategy.
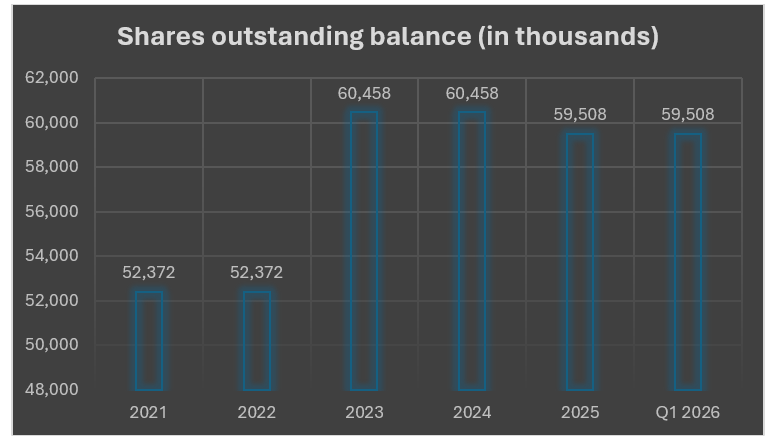
KCC has been conducting share buyback programs since 2024:
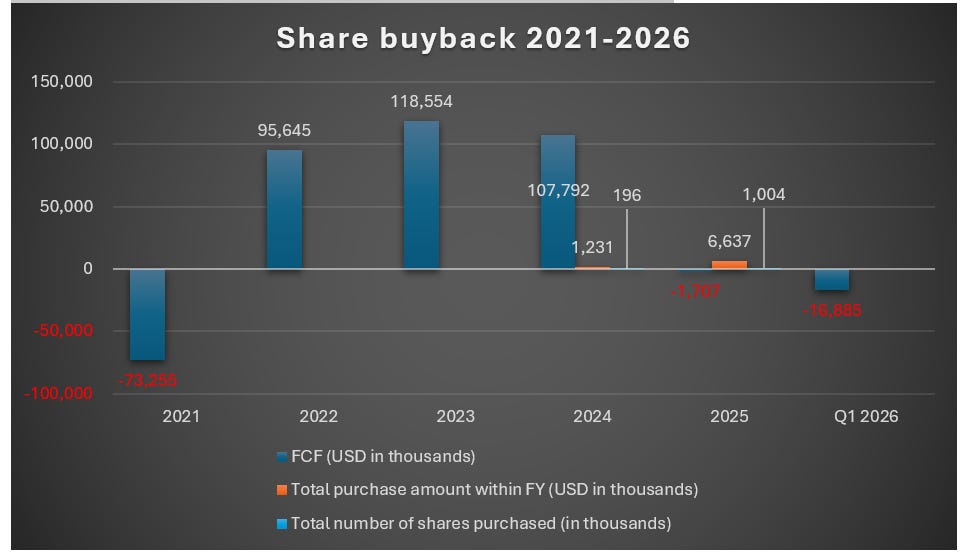
Source: Internal analysis based on KCC reports
Source: Internal analysis based on KCC reports
The management has not commented on any share buyback programs scheduled for 2026 and none were conducted in Q1 2026.
The cash and cash equivalents stand at USD 58.9 million, and with the long-term RCF capacity (USD 68 million), at USD 126.9 million. The shareholders’ equity as of 31 Mar 2026 is (in USD, millions):

Source: KCC, First Quarter 2026, Apr 28, 2026
Overall, a solid company with an interesting business. However, the rising net debt should be a concern if the cash flow from its operating activities declines as a result of weakening TCE rates.
What to expect in 2026?
KCC’s management guidance for Q2 2026 is that the results should be stronger than in Q1 2026. We have discussed the dry bulk and CPP markets in previous posts and their outlooks when we analysed dry bulk and tanker shipping companies. The outlook for both segments (including the global MR, LR1, Panamax and Kamsarmax fleet) remains the same.
The management reiterated that the conflict in the Middle East created a dislocation of the supply routes, which led to longer distances and fewer cargoes, in the case of CPP and the product tanker market. In the case of the dry bulk segment, they remain positive as long as the global economy and its GDP are growing.
Another important aspect that KCC management underlined is that there might be a short-term spike in tanker freight rates (in both CPP and DPP) upon the opening of the Strait of Hormuz and the clear inbound and outbound passages. The management reckons that once the passage is open, many CPP and crude oil consumers will rush to replenish their depleted SPR tanks, especially the CPP consumers.
By looking at the caustic soda solution segment, it is worth noting that Australia is the largest producer of alumina in the world. Australia’s import of caustic soda solution (CSS) is vital for KCC’s business model. As of today, there are no concerns of lower demand for CSS in Australia reported. Namely, in 2025, Australia’s CSS market size was 1.6 million tons and in 2026, it is expected to be at 1.7 million tons (2). So, we have a modest growth in demand for CSS.
Now, let’s have a look at risks.
Risks
One of the important risks that we have to underline is related to the global economy and its GDP growth. If the growth slows down, it might negatively affect the demand for dry bulk commodities. The above might not apply to the CPP and crude oil segments due to the strategic replenishment of the drawn levels in the SPR tanks.
Another risk is related to the demand and shipments of caustic soda solution from the Far East. It is highly dependent on Australian alumina refiners. Also, if the available volume of caustic soda solution in Asia is low, there is a potential for adverse effects on KCC’s financial metrics. In addition, one shall consider the risk related to the Middle Eastern smelters which import alumina from Australia, which, if the conflict persists, will eventually reduce the production of alumina and hence, the import of CCS.
We have to bear in mind the abovementioned risk factors due to high energy prices, which negatively affect the global GDP growth. It all depends on whether there will be a resolution for the Middle East conflict, and what the timeline will be.
Stock valuation
At the time of publishing (on 09 Jun 2026), the share price of KCC traded at:
Source: Yahoo Finance
Now, the analysts pin the 12-month price target at NOK 116.00-120.00.
KCC’s NAV per share is at USD 5.67, which makes around NOK 54.00:
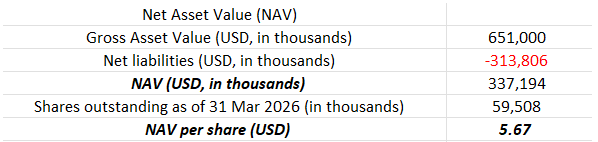
Source: Internal analysis
Now, if we compare NAV per share with the above, we can see that the current price of KCC is above NAV per share but below the target price pinned by analysts.
If we look at the P/NAV per share ratio (the current price of NOK 91.50 / NAV per share of NOK 54), we get 1.69x. This implies that the market prices the share 69 per cent higher than its underlying NAV. However, if we compare the price of NOK 91.50 versus the price targets, it seems undervalued. From the value investing perspective, we agree, the dry bulk, CSS and product tanker segments and their respective fleets outlook look constructive for the rest of the year. If we compare the price targets with the current price of NOK 91.50, there is a potential of 25-30 per cent of upside.
But despite the strong fundamental factors, the current price of 91.50 is on the higher end of the spectrum, which leaves us no room for the margin of safety. We would like to wait for a lower price, giving us a lower risk/higher reward option. Let’s put this one on our waiting list.
But as I mentioned before, it is up to you, my fellow value investors, to decide how a position fits your portfolio, considering your risk/reward perspective.
If you have any questions, don’t hesitate to get in touch with me or leave comments, and I shall do my best to shed light on the matter.
Thank you for reading,
Value Investor in Shipping
Disclaimer: It is not financial advice but a research-based fundamental analysis.
Please find us on: https://valueinvestinginshipping@substack.com
Sources:
1 KCC, Annual Report 2025
2 https://www.imarcgroup.com/australia-caustic-soda-market?utm